The Passing Bar For A Top 10 College Football Team Has Changed
The passing floor for national-title contenders has quietly risen over the last two decades, and the separation is coming from efficiency as much as volume.
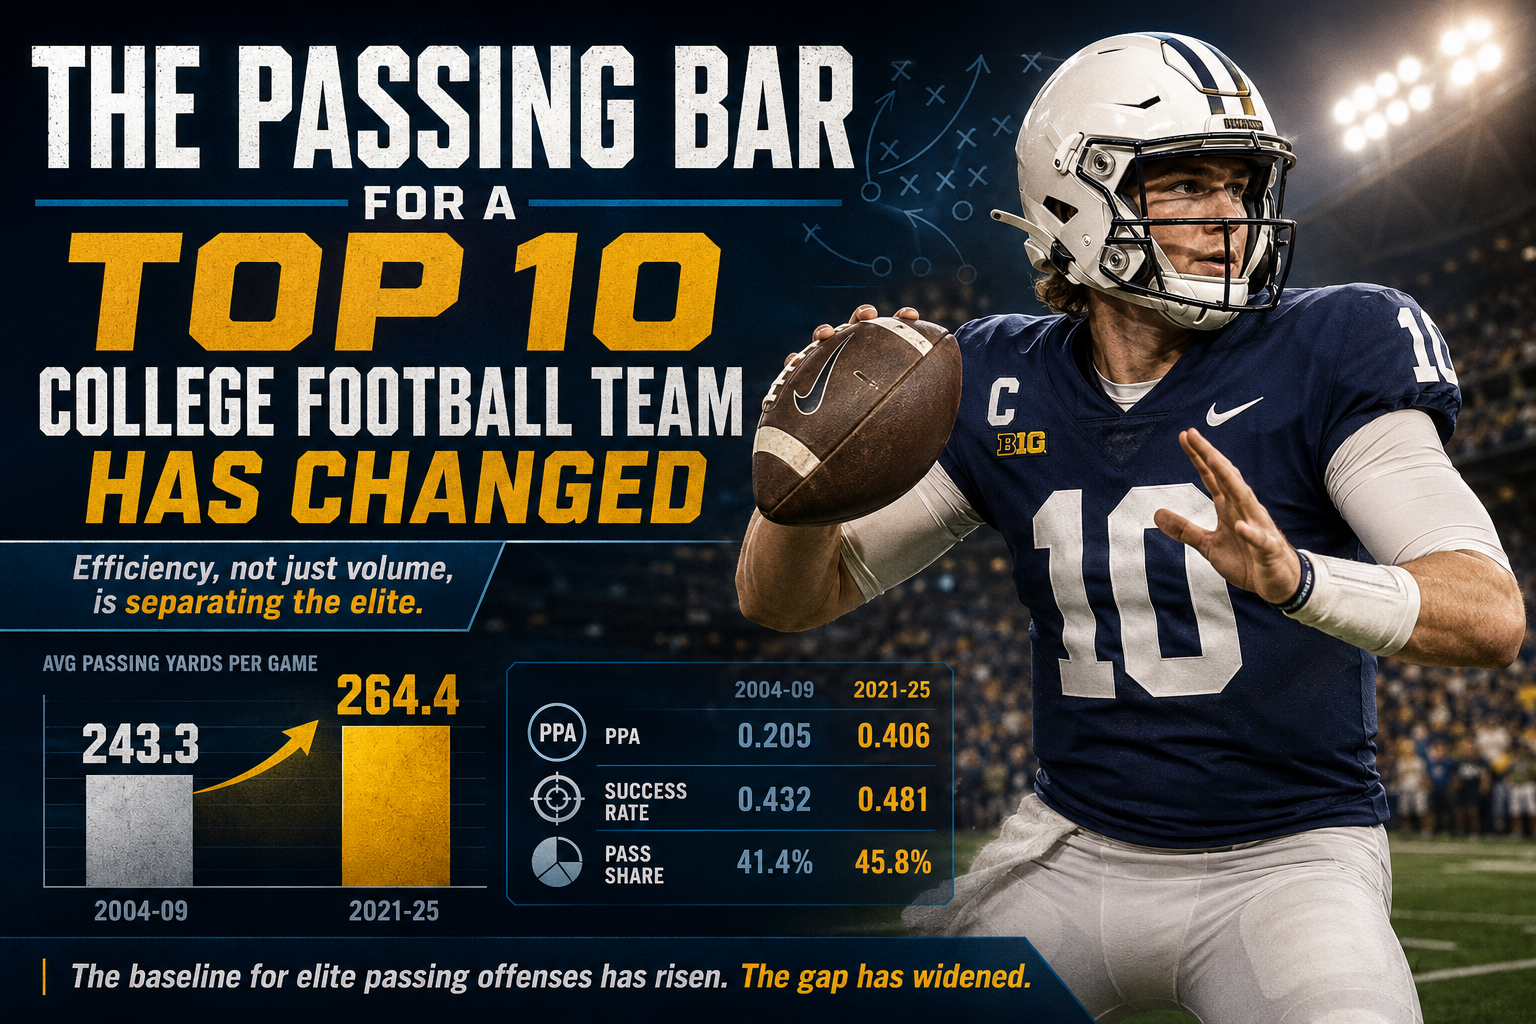
Elite teams are not just throwing for more yards than they used to. They are throwing more efficiently, generating more value per attempt, and relying on the passing game more consistently in the biggest moments of the season.
That evolution changes what a modern Top 10 team looks like.
To test the idea, I pulled every final AP Top 10 team from CFBTrack's local data window from 2004 through 2025 and matched those teams against their passing production and advanced offensive metrics.
The surface-level answer is obvious: yes, elite teams throw for more yards now than they did 20 years ago.
The deeper answer is more interesting.
The biggest change is not simply that championship-level teams pass more often. It is that the baseline for efficient passing offense has moved upward.
From 2004-09, final AP Top 10 teams averaged 3,175 passing yards and 243.3 passing yards per game. From 2021-25, those numbers climbed to 3,713 passing yards and 264.4 per game.
That is a meaningful increase, especially because the earlier sample already included several elite passing offenses. The 2008 Oklahoma team threw for 4,988 yards and 51 touchdowns. This is not comparing modern football against the leather-helmet era. It is modern college football compared against an even more pass-oriented version of itself.
Raw totals need context, though.
The best teams now play more games because of conference championship matchups, playoff expansion, and longer postseason runs. That is why the per-game numbers matter more than the season totals. The increase from 243.3 to 264.4 passing yards per game tells us the passing game occupies more space inside elite offenses now, not merely that teams get extra Saturdays.
The advanced metrics make the trend even clearer.
From 2004-09, final AP Top 10 teams averaged:
- 0.205 passing PPA
- 0.432 passing success rate
From 2021-25, those numbers rose to:
- 0.406 passing PPA
- 0.481 passing success rate
PPA, or Predicted Points Added, measures how much value each play creates toward scoring. Success rate measures how consistently an offense stays ahead of schedule relative to down and distance.
That is the real story.
Modern Top 10 passing offenses are not just larger. They are more reliable, more efficient, and much better at turning individual plays into sustainable offensive value.
Here is the era-by-era view:
| Window | Avg pass yards | Avg pass yards/game | Avg attempts/game | Pass share | Passing PPA | Passing success rate |
|---|---|---|---|---|---|---|
| 2004-09 | 3,175 | 243.3 | 28.7 | 41.4% | 0.205 | 0.432 |
| 2010-15 | 3,433 | 255.8 | 30.0 | 41.7% | 0.274 | 0.461 |
| 2016-20 | 3,548 | 268.4 | 31.1 | 43.9% | 0.415 | 0.480 |
| 2021-25 | 3,713 | 264.4 | 31.1 | 45.8% | 0.406 | 0.481 |
The table also keeps the argument grounded.
This is not about every season continuously setting new passing records. The 2021-25 sample actually sits slightly below the 2016-20 peak in passing yards per game, a stretch fueled by offenses like 2019 LSU, 2019 Clemson, 2018 Alabama, 2018 Ohio State, and 2018 Washington State.
The story is not that the ceiling keeps rising forever.
The story is that the baseline changed.
The comparison against the rest of the FBS makes that point even stronger.
All FBS teams averaged 231.4 passing yards per game from 2004-09 and actually declined slightly to 229.1 by 2021-25, while final AP Top 10 teams jumped from 243.3 to 264.4 over the same span.
In other words, the national-title tier widened its passing advantage over the rest of the sport.
The edge grew from roughly 12 passing yards per game to around 35.
That matters because it shows this is not simply a sport-wide increase in passing volume. The best teams are separating themselves more clearly through efficient passing offense.
The pass-share trend tells a similar story.
In the mid-2000s, plenty of Top 10 teams could thrive with defense, field position, option football, or dominant rushing attacks while treating the passing game as a supporting piece.
That profile is much rarer now.
By 2021-25, final AP Top 10 teams averaged a 45.8 percent box-score pass share. The best teams did not abandon the run. They simply became less willing to treat the passing game as secondary.
The individual seasons make the trend feel even more obvious.
The clearest example is the 2019 LSU Tigers football.
That team finished No. 1 while throwing for:
- 6,024 yards
- 401.6 yards per game
- 61 touchdowns
- 0.613 passing PPA
That offense represented the extreme version of the modern championship formula: explosive passing, efficient passing, and relentless offensive pressure.
But LSU was not alone.
Across multiple eras, the teams that reached the very top of the sport increasingly shared the same characteristic: passing offenses capable of overwhelming even elite defenses.
Oklahoma Sooners football finished No. 3 with 5,065 passing yards and an absurd 11.7 yards per attempt.
Alabama Crimson Tide football finished No. 2 with 5,073 passing yards and 48 passing touchdowns.
Washington Huskies football finished No. 2 with 5,155 passing yards and 343.7 yards per game.
Ohio State Buckeyes football averaged 380.9 passing yards per game despite not playing a 15-game schedule.
The quarterbacks from those teams became stars, but the broader point is structural.
Modern elite passing offenses solve problems.
They create explosive plays when defenses overload the box. They survive third-and-long. They keep pace in playoff shootouts. They turn elite skill talent into easy yards. They punish mistakes immediately.
A team can still win games without all of that.
Consistently finishing in the final Top 10 is becoming harder without it.
There are still exceptions, which is what makes the trend interesting instead of absolute.
West Virginia Mountaineers football finished No. 5 with only 1,493 passing yards because its rushing attack overwhelmed opponents.
Georgia Tech Yellow Jackets football finished No. 8 with 1,882 passing yards because the option offense created efficiency through structure and possession control instead of explosive passing.
LSU Tigers football finished No. 2 with 2,250 passing yards because its defense and field-position game suffocated opponents.
Even Northwestern Wildcats football reached No. 10 during the shortened 2020 season with only 1,790 passing yards.
Those teams succeeded because they possessed something historically dominant elsewhere: overwhelming defense, elite rushing efficiency, or unusual schematic advantages relative to their era.
That is exactly why they stand out now.
Those profiles increasingly feel like special cases instead of repeatable championship formulas.
A dominant run game still matters. A great defense still matters. But the most reliable path to the top of the sport now usually includes a passing offense capable of carrying games instead of merely protecting leads.
For fans, that changes how contenders should be evaluated.
A Top 10 resume is no longer just about record, recruiting stars, or brand power. One of the clearest signals of a legitimate championship threat is whether the passing game can continue functioning against playoff-level defenses in obvious passing situations, which is why CFBTrack's team season leaders, stats search, and rankings archive are useful together.
The sport still allows different paths to contention, but the margin for surviving with a limited passing offense keeps getting smaller every season.