Usage / Role
76%
Major defensive role
lowfeatured
Player Dossier
2014-2018Kansas
DT • 6'3" • 290 lbs • Lewisville, TX, USA
Daniel Wise shows a ball-hunting defender profile with 32.4 disruption score.
Usage / Role
76%
Major defensive role
Impact Production
100
Top-tier box-score impact for a defensive lineman
Reliability
65
Reliable weekly contributor
Star Power
85
Elite ceiling indicators
Career Arc
Value trend by season
Best season by Season Value: 2017 Regular Season · Kansas
Snapshot
Player Story
Daniel Wise built his college career from 2014 through 2018 as a defensive tackle from Lewisville, TX wearing No. 96, spending time with Kansas. The clearest part of Daniel Wise's career was his defensive production:...
Read the storyDaniel Wise, DT. Best season Best season by Season Value: 2017 Regular Season · Kansas. Daniel Wise shows a ball-hunting defender profile with 32.4 disruption score.
Stat Footprint
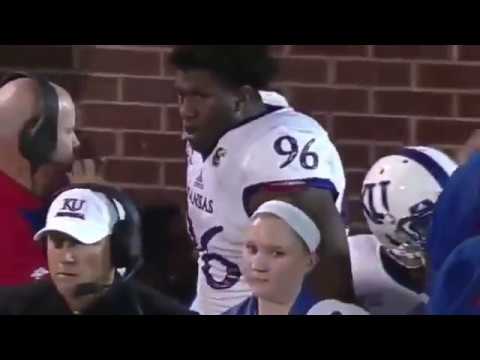
Featured Highlight
Daniel Wise Kansas Highlights
2018 · Kansas · Player Highlight
Daniel Wise college highlights at Kansas.
Quick Answers
Season Ledger
| Season | Team | Games | Tackles | TFL | Sacks | QB Hur | PD | TD | Overall |
|---|---|---|---|---|---|---|---|---|---|
| 2014 Regular Season | Kansas | 0 | 0 | - | 0 | - | - | 0 | - |
| 2015 Regular Season | Kansas | 0 | 0 | - | 0 | - | - | 0 | - |
| 2016 Regular Season | Kansas | 11 | 38 | 10 | 3 | 3 | 1 | 0 | 49.6 |
| 2017 Regular Season | Kansas | 12 | 54 | 16.5 | 6.5 | 6 | 1 | 0 | 71.3 |
| 2018 Regular Season | Kansas | 11 | 34 | 12 | 5 | 5 | - | 0 | 66.1 |
Related Context
Daniel Wise played DT for Kansas. Across 5 tracked seasons, Daniel Wise recorded 126 tackles. His top tracked season came in 2017 with Kansas.
Lead takeaway
Best season by value score: 2017 Regular Season
Kansas paired 30 primary output with 41.7 efficiency.
Supporting note
2018 Regular Season role shape
impact-led usage with 32.4 efficiency.
Supporting note
Career value cooled off
2018 Regular Season fell back from the prior stop by season value score.
Supporting note
Peak game by takeover score: West Virginia
Loss with backfield disruption leading the way. It landed in the 100th percentile of the selected season.
Analysis workspace
Filter the strongest season sample, inspect game-level shape, and then drop into the full log without losing the story of the year.
Understand the selected season before dropping into the full game log.
Games
11
Havoc Plays / G
2
Efficiency
32.4
Usage
12.4
Consistency
58.5
Best Game by takeover score
West Virginia
Active game
Hover over a point
Hover or select a game to keep its context visible here without the page shifting around.
Follow how the selected stat changes from one game to the next. Spikes mark standout outings, while dips show quieter weeks.
Chronological game order.
Game by game trend chart. Nicholls: 1. Rutgers: 2. Baylor: 2. Oklahoma State: 0. West Virginia: 5.5. Texas Tech: 2. TCU: 0. Iowa State: 3. Kansas State: 1.5. Oklahoma: 1. Texas: 4
Each dot is a game. Farther right means the player carried more of the workload, and higher means they were more efficient with those chances.
Low volumeHigh quality
High volumeHigh quality
Low volumeLower quality
High volumeLower quality
Volume on the x-axis, quality on the y-axis.
Volume versus efficiency scatter chart. Nicholls: 8 by 43.3. Rutgers: 1 by 24.2. Baylor: 3 by 32.5. Oklahoma State: 1 by 4.2. West Virginia: 5 by 70.8. Texas Tech: 3 by 32.5. TCU: 4 by 16.7. Iowa State: 1 by 34.2. Kansas State: 3 by 27.5. Oklahoma: 0 by 10. Texas: 5 by 60.8
Compare how this player performed across different situations. "Games" shows how many matchups are included in each split.
Dense stat lines with inline explanations and season-linked highlights.
11 games
Featured metric
Havoc Plays
Top game by takeover score
West Virginia
Best efficiency game
70.8 vs West Virginia
| Result | |||||||||||
|---|---|---|---|---|---|---|---|---|---|---|---|
| Fri 11/23 | vs TexasSplash game | L 17-24 | 5 | 5 | — | 3 | 1 | — | 0 | — | — |
| Sun 11/18 | @ Oklahoma | L 40-55 | 0 | 0 | — | 0 | 0 | — | 0 | — | — |
| Sat 11/10 | @ Kansas State | L 17-21 | 3 | 2 | — | 0.50 | 0 | — | 0 | — | — |
| Sat 11/3 | vs Iowa StateSplash game | L 3-27 | 1 | 1 | — | 1 | 1 | — | 0 | — | — |
| Sat 10/27 | vs TCU | W 27-26 | 4 | 2 | — | 0 | 0 | — | 0 | — | — |
| Sat 10/20 | @ Texas TechSplash game | L 16-48 | 3 | 2 | — | 1 | 0 | — | 0 | — | — |
| Sat 10/6 | @ West Virginia2+ sacks · Splash game | L 22-38 | 5 | 4 | — | 3.50 | 2 | — | 0 | — | — |
| Sat 9/29 | vs Oklahoma State | L 28-48 | 1 | 1 | — | 0 | 0 | — | 0 | — | — |
| Sat 9/22 | @ BaylorSplash game | L 7-26 | 3 | 3 | — | 1 | 1 | — | 0 | — | — |
| Sat 9/15 | vs RutgersSplash game | W 55-14 | 1 | 1 | — | 1 | 0 | — | 0 | — | — |
| Sat 9/1 | vs Nicholls | L 23-26 | 8 | 6 | — | 1 | 0 | — | 0 | — | — |
Player Story
Daniel Wise built his college career from 2014 through 2018 as a defensive tackle from Lewisville, TX wearing No. 96, spending time with Kansas. The clearest part of Daniel Wise's career was his defensive production: 126 tackles, 38.5 tackles for loss, 14.5 sacks, and 2 passes defended across 34 career games in the available record. His largest box-score season came in 2017 with Kansas. Those numbers show where he fit, how often the ball or action found him, and how his role developed over time.
Defensive careers can be hard to read from one number, but Daniel Wise's production has multiple signals. With 34 career games in the available record, his career has enough shape to show both opportunity and production across Kansas.
The arc is straightforward: Daniel Wise moved through the depth chart, found a larger role, and turned that opportunity into production that can be understood through standard football numbers.
Track team changes, role shifts, and season-to-season movement.
Kansas
2014-2018
Opening stop
Season Value Progression
| Season | Team | Primary | Efficiency | Usage | Delta |
|---|---|---|---|---|---|
| 2014 Regular Season | Kansas | 0 | — | — | — |
| 2015 Regular Season | Kansas | 0 | — | — | 0 |
| 2016 Regular Season | Kansas | 17 | 29.8 | 9.4 | 17 |
| 2017 Regular Season | Kansas | 30 | 41.7 | 13.1 | 13 |
| 2018 Regular Season | Kansas | 22 | 32.4 | 12.4 | -8 |
#1 Featured game
vs Ohio
Week 2 · L 21-37
Loss with 5 impact plays across the defensive snap sheet.
5
Havoc Plays
94.4 takeover
5 disruption/tackle impact with 94.4 takeover score.
#2
vs Texas
Week 12 · W 24-21 · Conference game
5
Havoc Plays
90.3 takeover
Win with backfield disruption leading the way.
5 disruption/tackle impact with 90.3 takeover score.
#3
@ West Virginia
Week 6 · L 22-38 · Conference game
5.5
Havoc Plays
90.3 takeover
Loss with backfield disruption leading the way.
5.5 disruption/tackle impact with 90.3 takeover score.
#4
vs Kansas State
Week 9 · L 20-30 · Conference game
6.5
Havoc Plays
88.9 takeover
Loss with backfield disruption leading the way.
6.5 disruption/tackle impact with 88.9 takeover score.
#5
vs Southeast Missouri State
Week 1 · W 38-16
6
Havoc Plays
87.7 takeover
Win with 6 impact plays across the defensive snap sheet.
6 disruption/tackle impact with 87.7 takeover score.
#1 Season by Season Value
2017 Regular Season · Kansas
30 primary output · 41.7 efficiency · 13.1 usage
71.3
#2
2018 Regular Season · Kansas
66.1
22 primary · 32.4 efficiency · 12.4 usage
#3
2016 Regular Season · Kansas
49.6
17 primary · 29.8 efficiency · 9.4 usage
12
Impact games
16
Splash games
0
10+ tackle games
Next best actions
Move from the player story into the game log, career arc, team context, and video shelf.